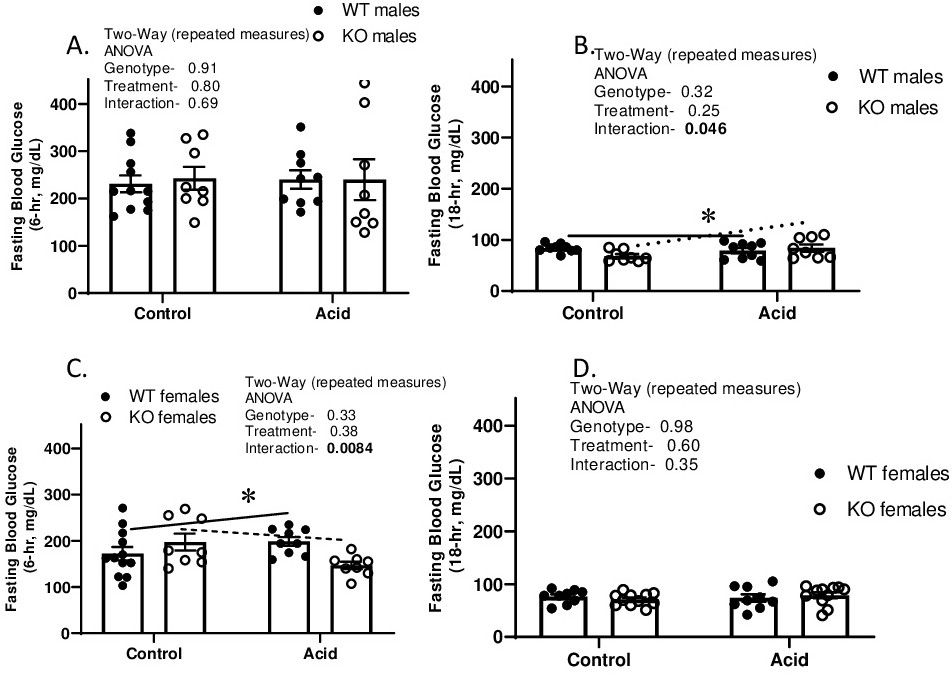
Fig. 2. Fasting glucose. Mice sampled under control then 1-week acid loading; blood glucose after A. 6-hour fast in males; B. 18-hour fast in males; C. 6-hour fast in females; and D. 18-hr fast in females; (n = 8-11/genotype, mean ± standard deviation); WT (closed circles) and KO (open circles). *indicates a significant interaction between genotype and treatment by two-way repeated measures ANOVA. P-values shown in the inset with significant values (p<0.05) bolded.